Hello Everyone,
I am working on a project and unfortunately there is some problem with the timer interrupt, when complete code is enabled this interrupt doesn't triggered at the rate programmed by me.
It looks that some other interrupt or some other piece of code (in which i disabled the interrupt) is causing this behavior.
So my main aim is to find the problem, so for that i thought i will use "Interrupt Log" feature present in IAR Embedded Workbench for ARM.
https://www.iar.com/support/resources/articles/interrupt-logging/I am using ATSAMC20J18A micro-controller and J-Link Plus as Debugger in IAR 7.60
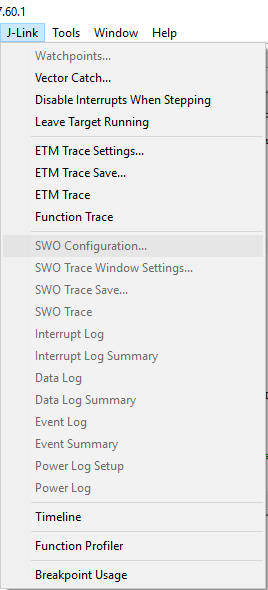
But when i debug my code, and try to open the interrupt log window, everything is disabled here, please see the snapshot below.

Even i read about ETM trace feature and it looks using this i can figure out the problem in my code.
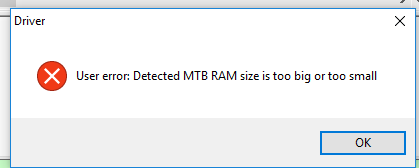
And these settings are also enabled in my code, but again when i tried to use them i get error which is as follow:

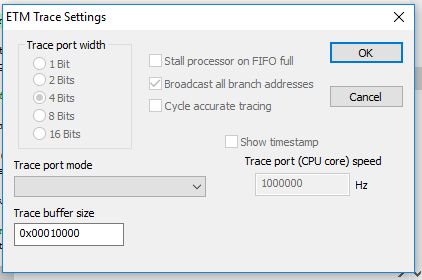
I checked the ETM Trace Setting and it looks it has nothing that i can change.

I am assuming that i can't use ETM Trace using the J-Link and for that i need J-Trace, but other things should work, like Interrupt Log, Timeline but nothing is working.
Please suggest how can i enable this interrupt log feature or any other way to debug the problem.


